Available CashCtrl PRO reports
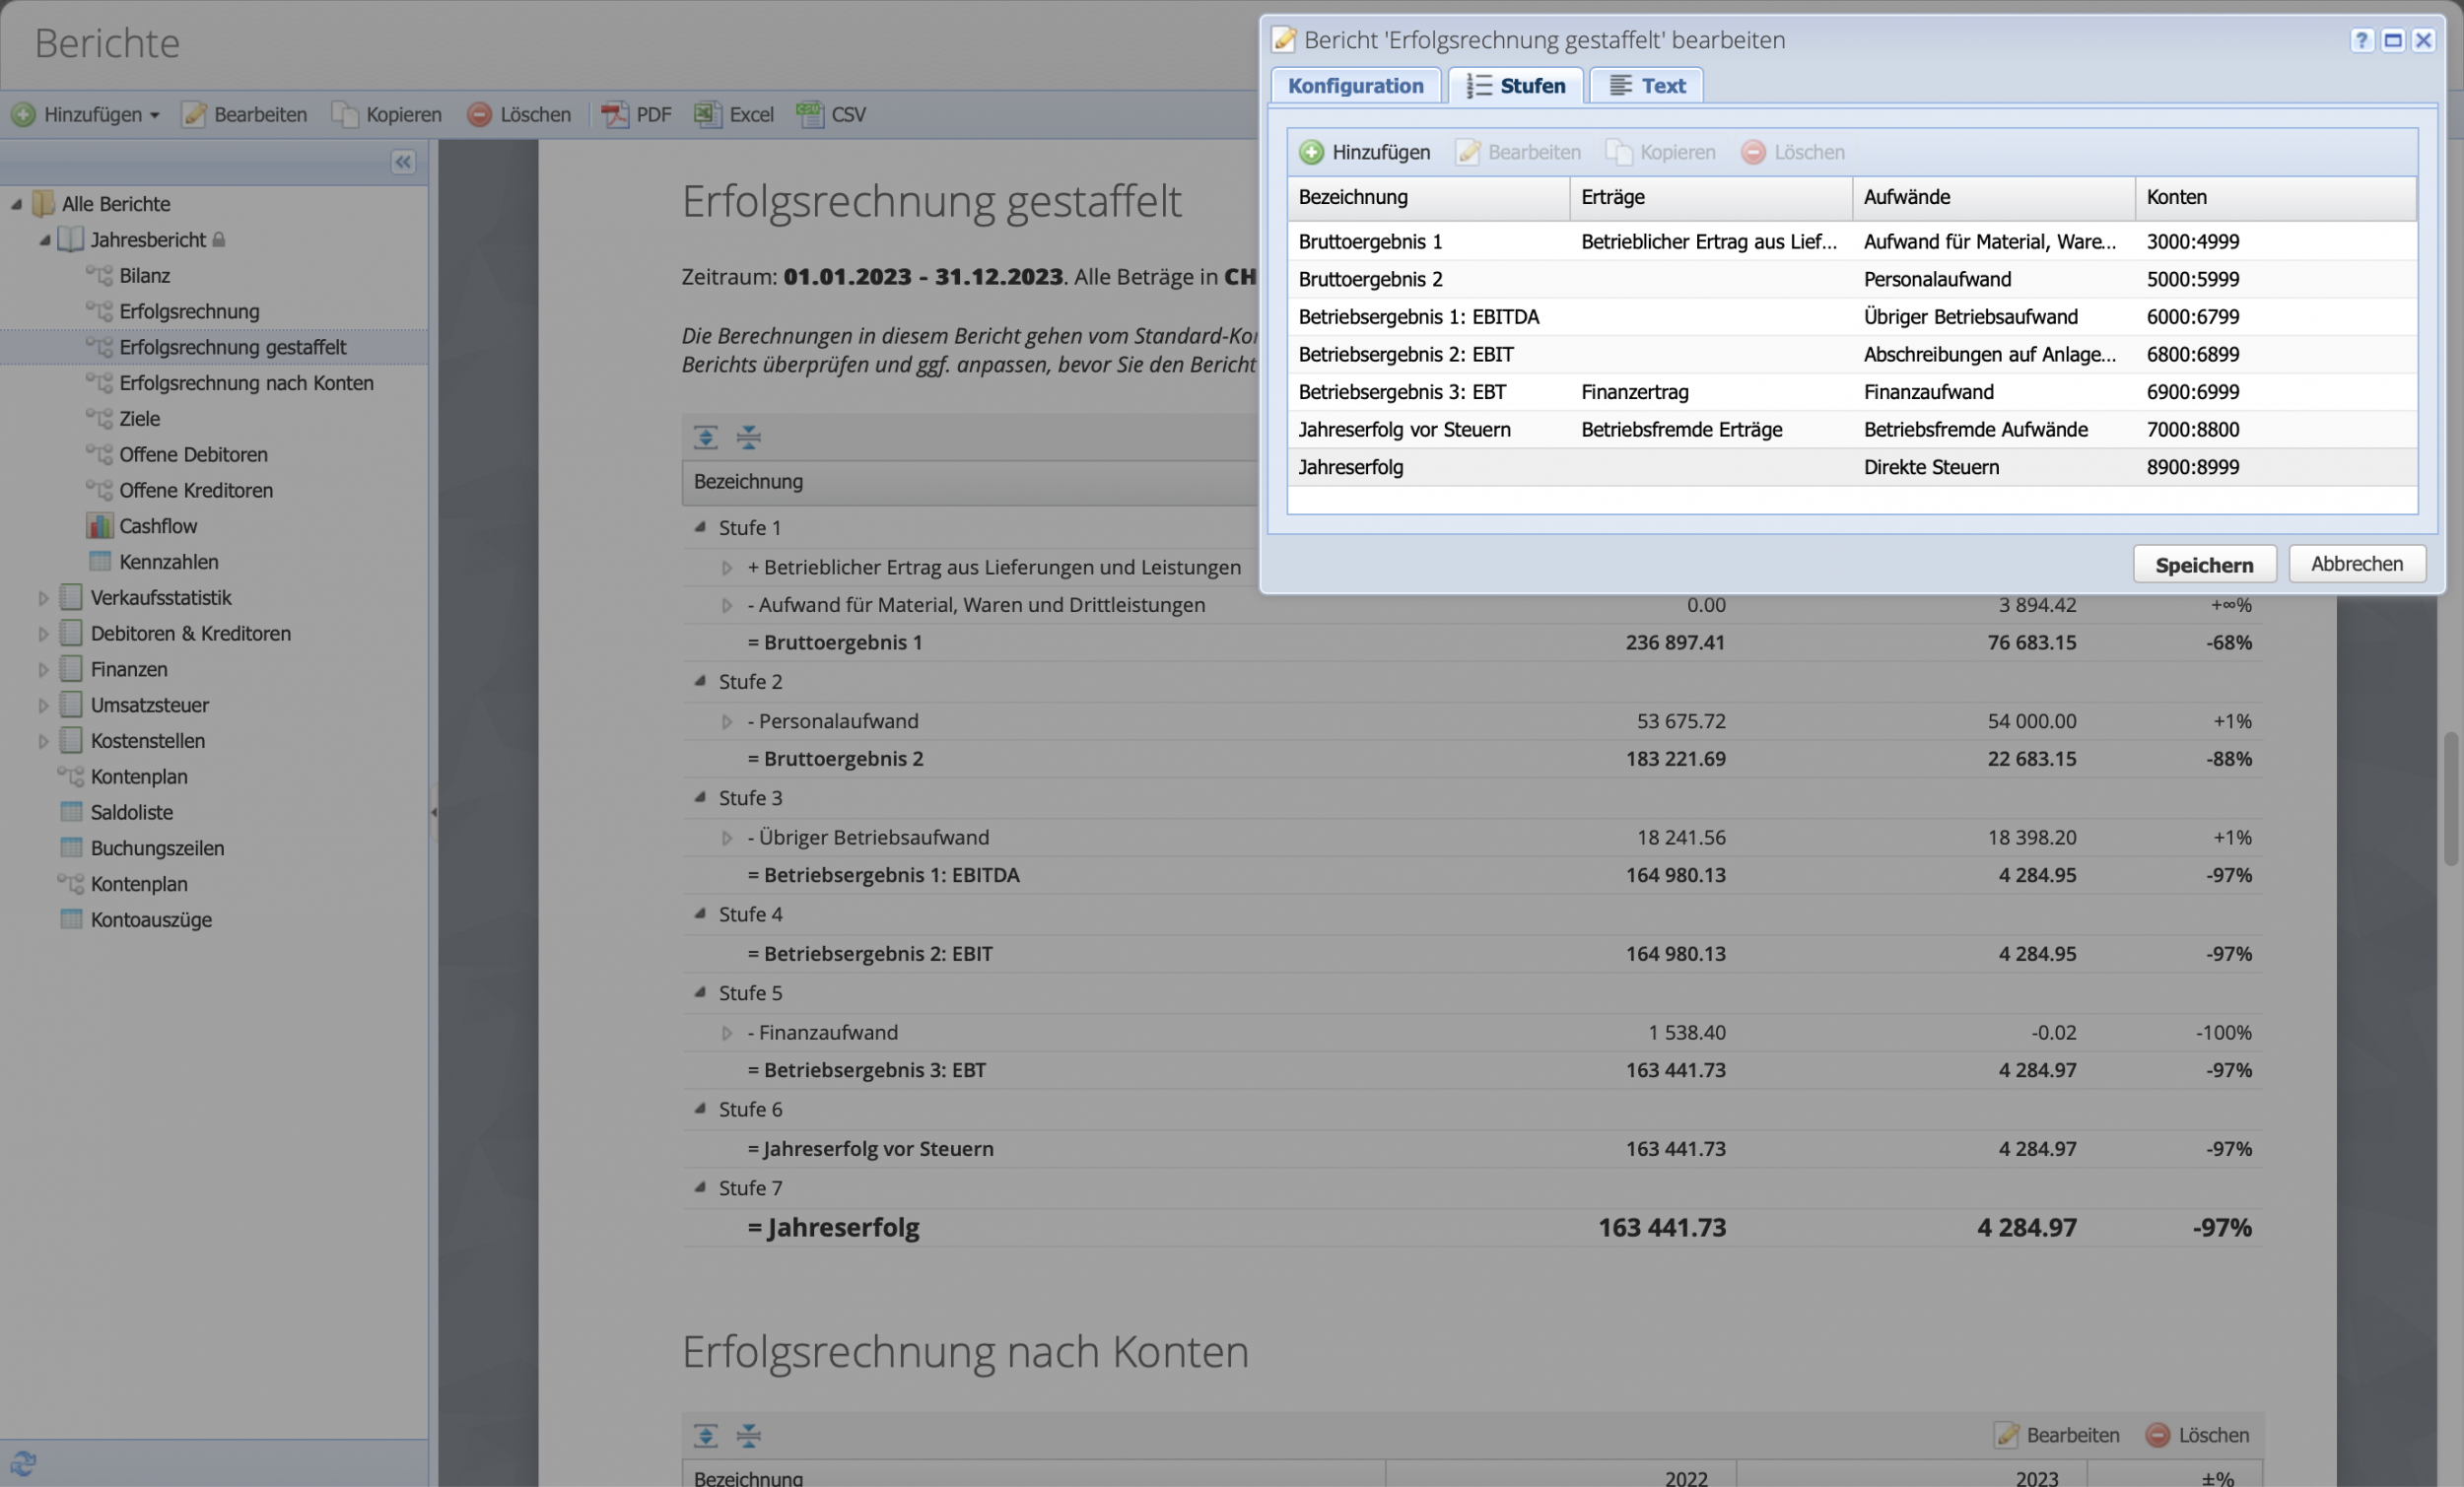
- Staggered income statement
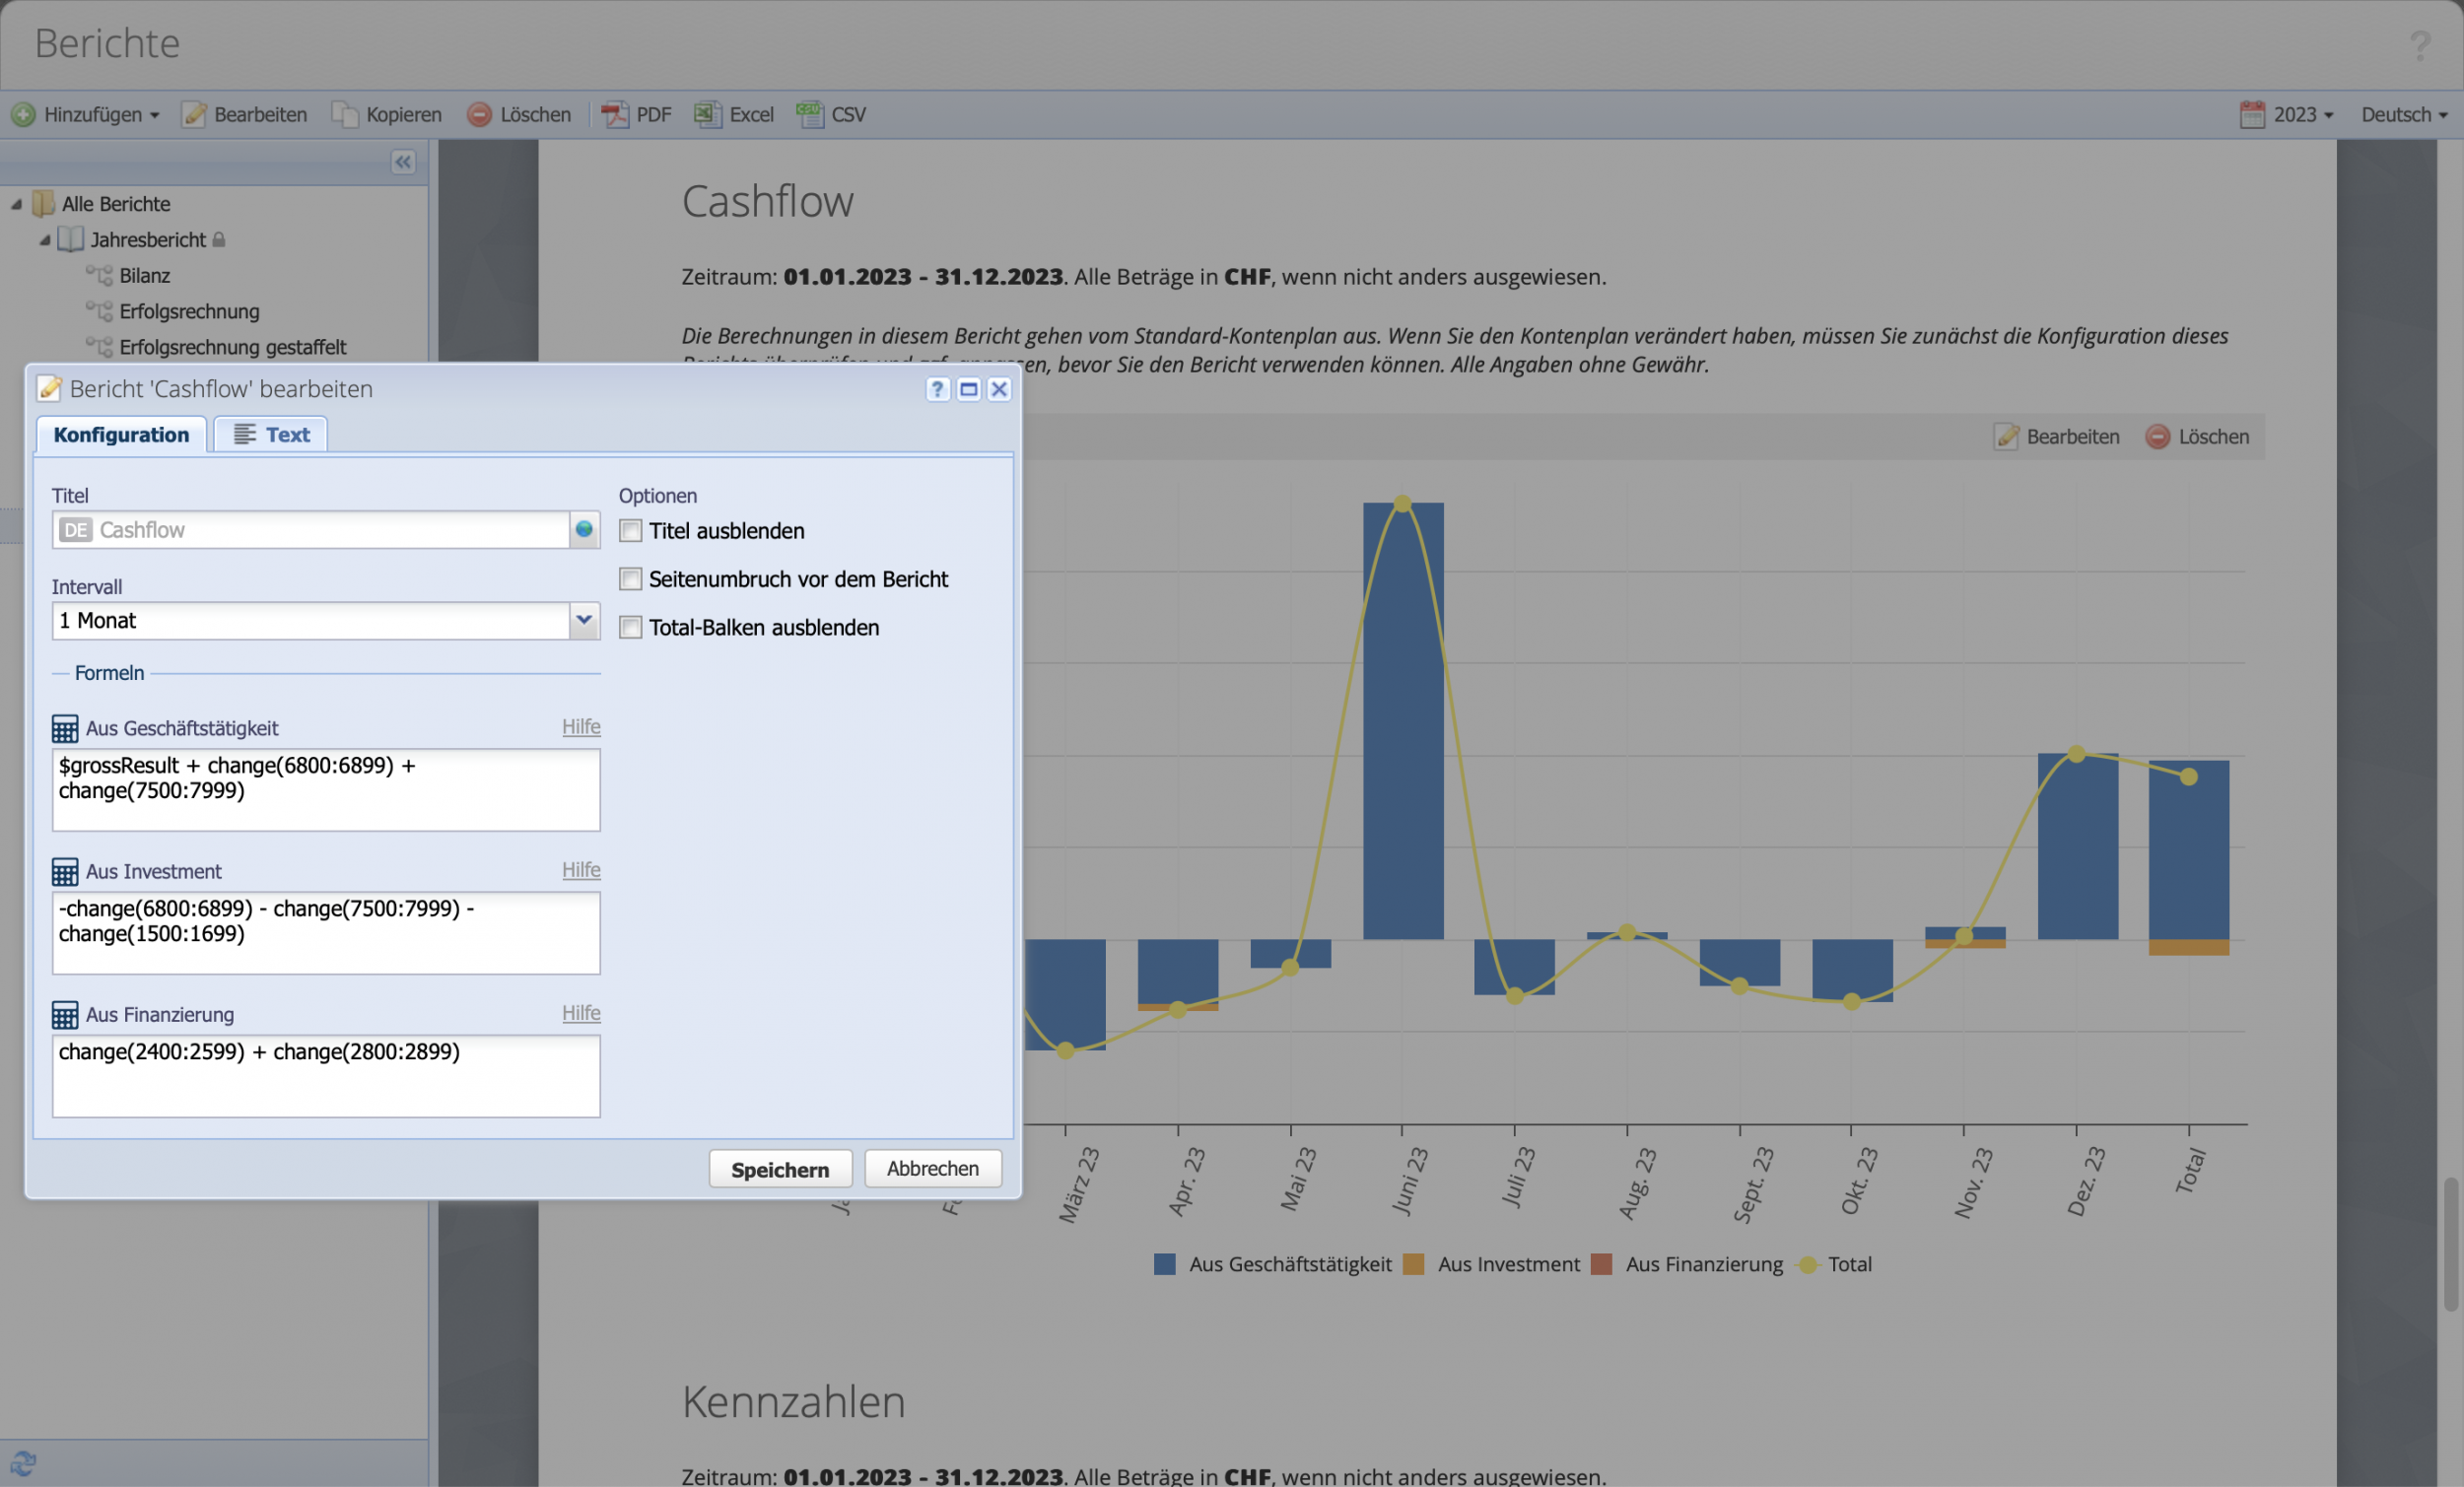
- Cash flow
- Key figures
- Revenue by customer (pie chart)
- Expense by vendors (pie chart)
- Result by articles (pie chart)
- Balance share (pie chart)
- Balance progression (line chart)
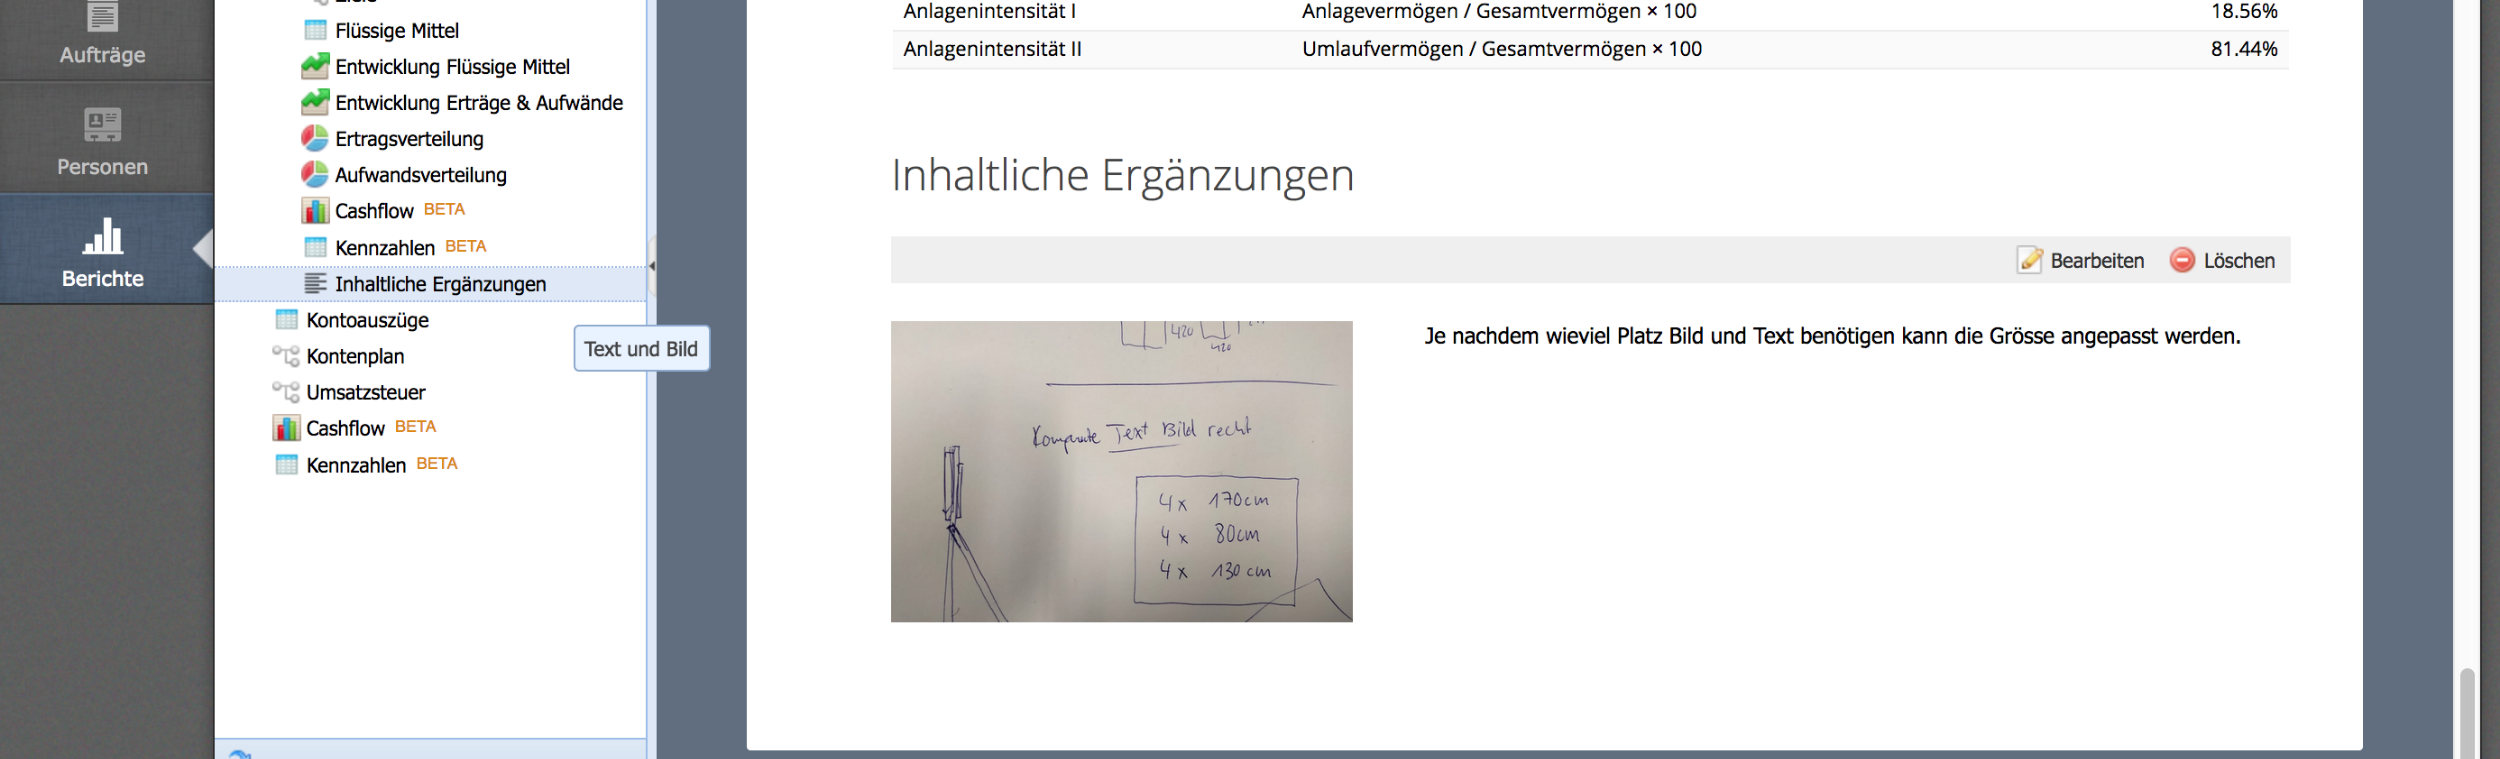
- Text and image
Please enter a search term.
Error ~ No results could be loaded.
CashCtrl PRO includes all available reports and evaluations. Individual report sets can be created and the appearance can be configured with additional elements as desired.
All reports are available for download as PDF, Excel document or CSV file.
An income statement in staggered form (EBITDA / EBIT / EBT) is available for the annual report. The levels can be defined by the user.
With the Cashflow report you have a better overview of the inflow and outflow of cash and cash equivalents. A standard configuration of CashCtrl is set, which can be adjusted via formulas. Possible are account ranges with 1000:1999 and individual accounts comma-separated.
The key figures report is structured in tabular form, an individual arrangement of the rows and titles is possible.
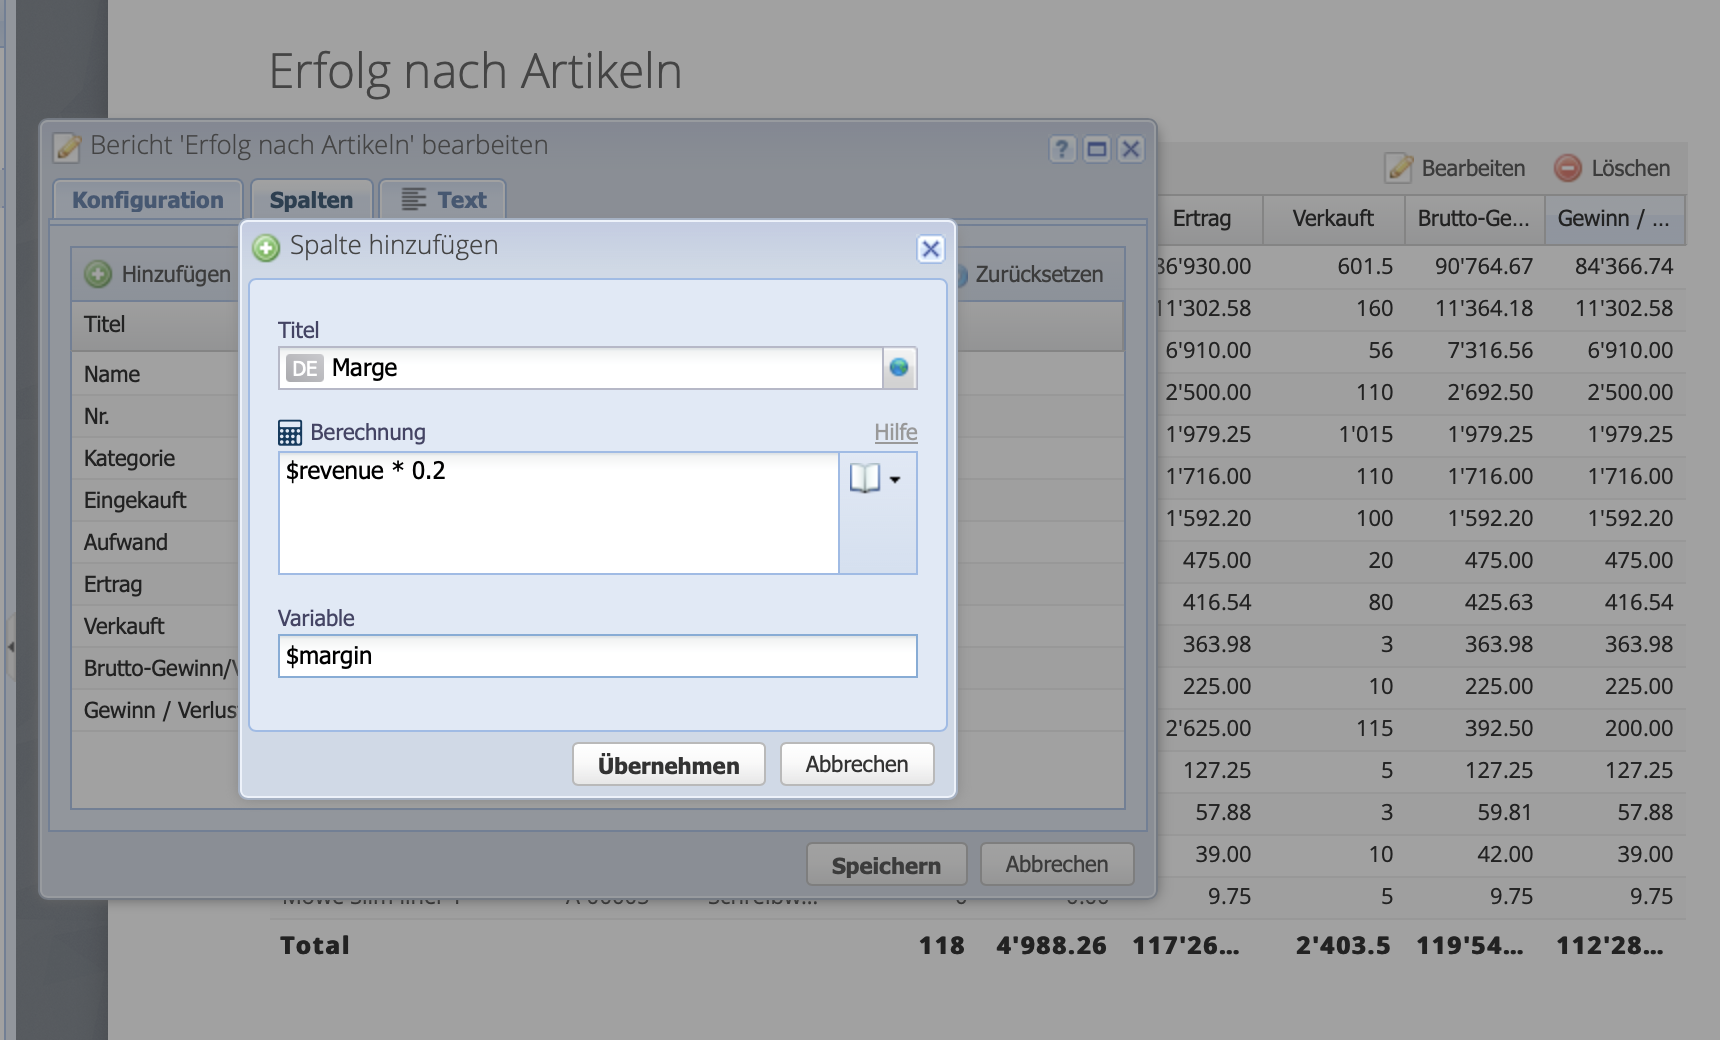
A created formula can be inserted as a variable in a new calculation. If a formula is only used for calculation, it can be hidden so that it is not listed in the report.
Via "Help" at the formula field you can go to the documentation / glossary of formulas. All variables are listed and explained.
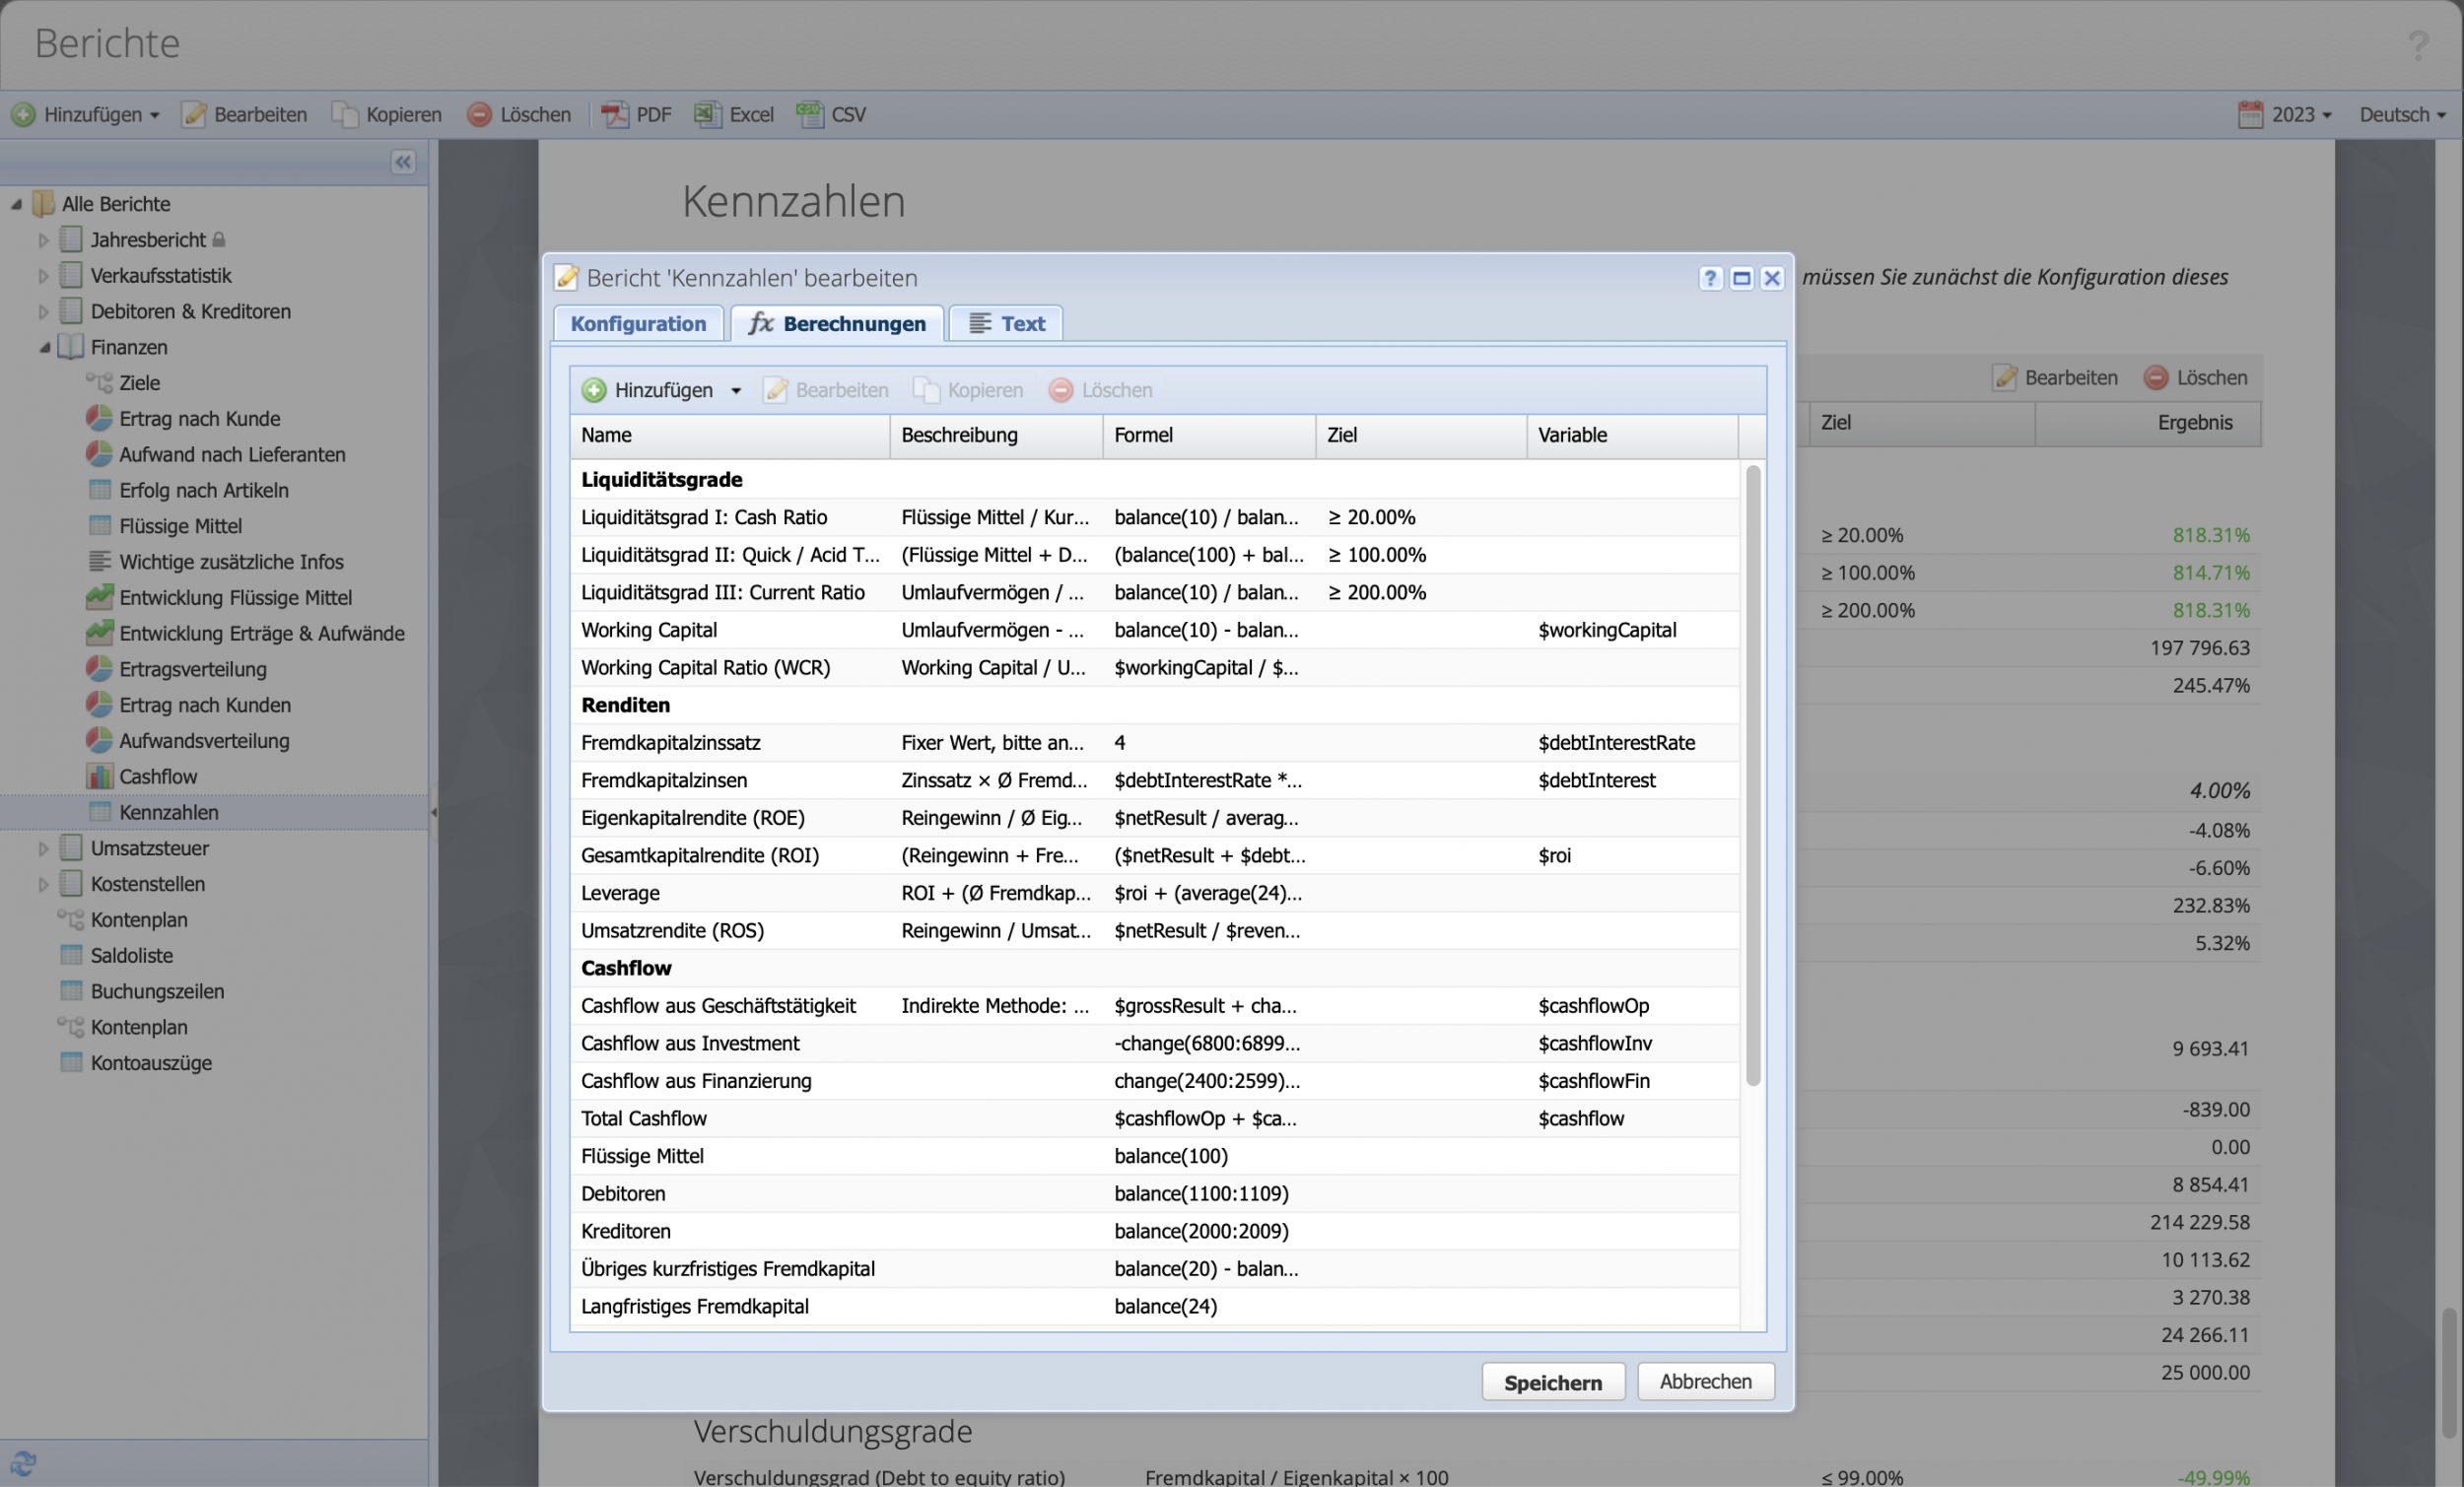
The formula column is used to calculate individual key figures. It is available in all tabular reports, but not in graphical reports such as the pie chart.
This column is suitable, for example, to create a column for margin or other calculations.
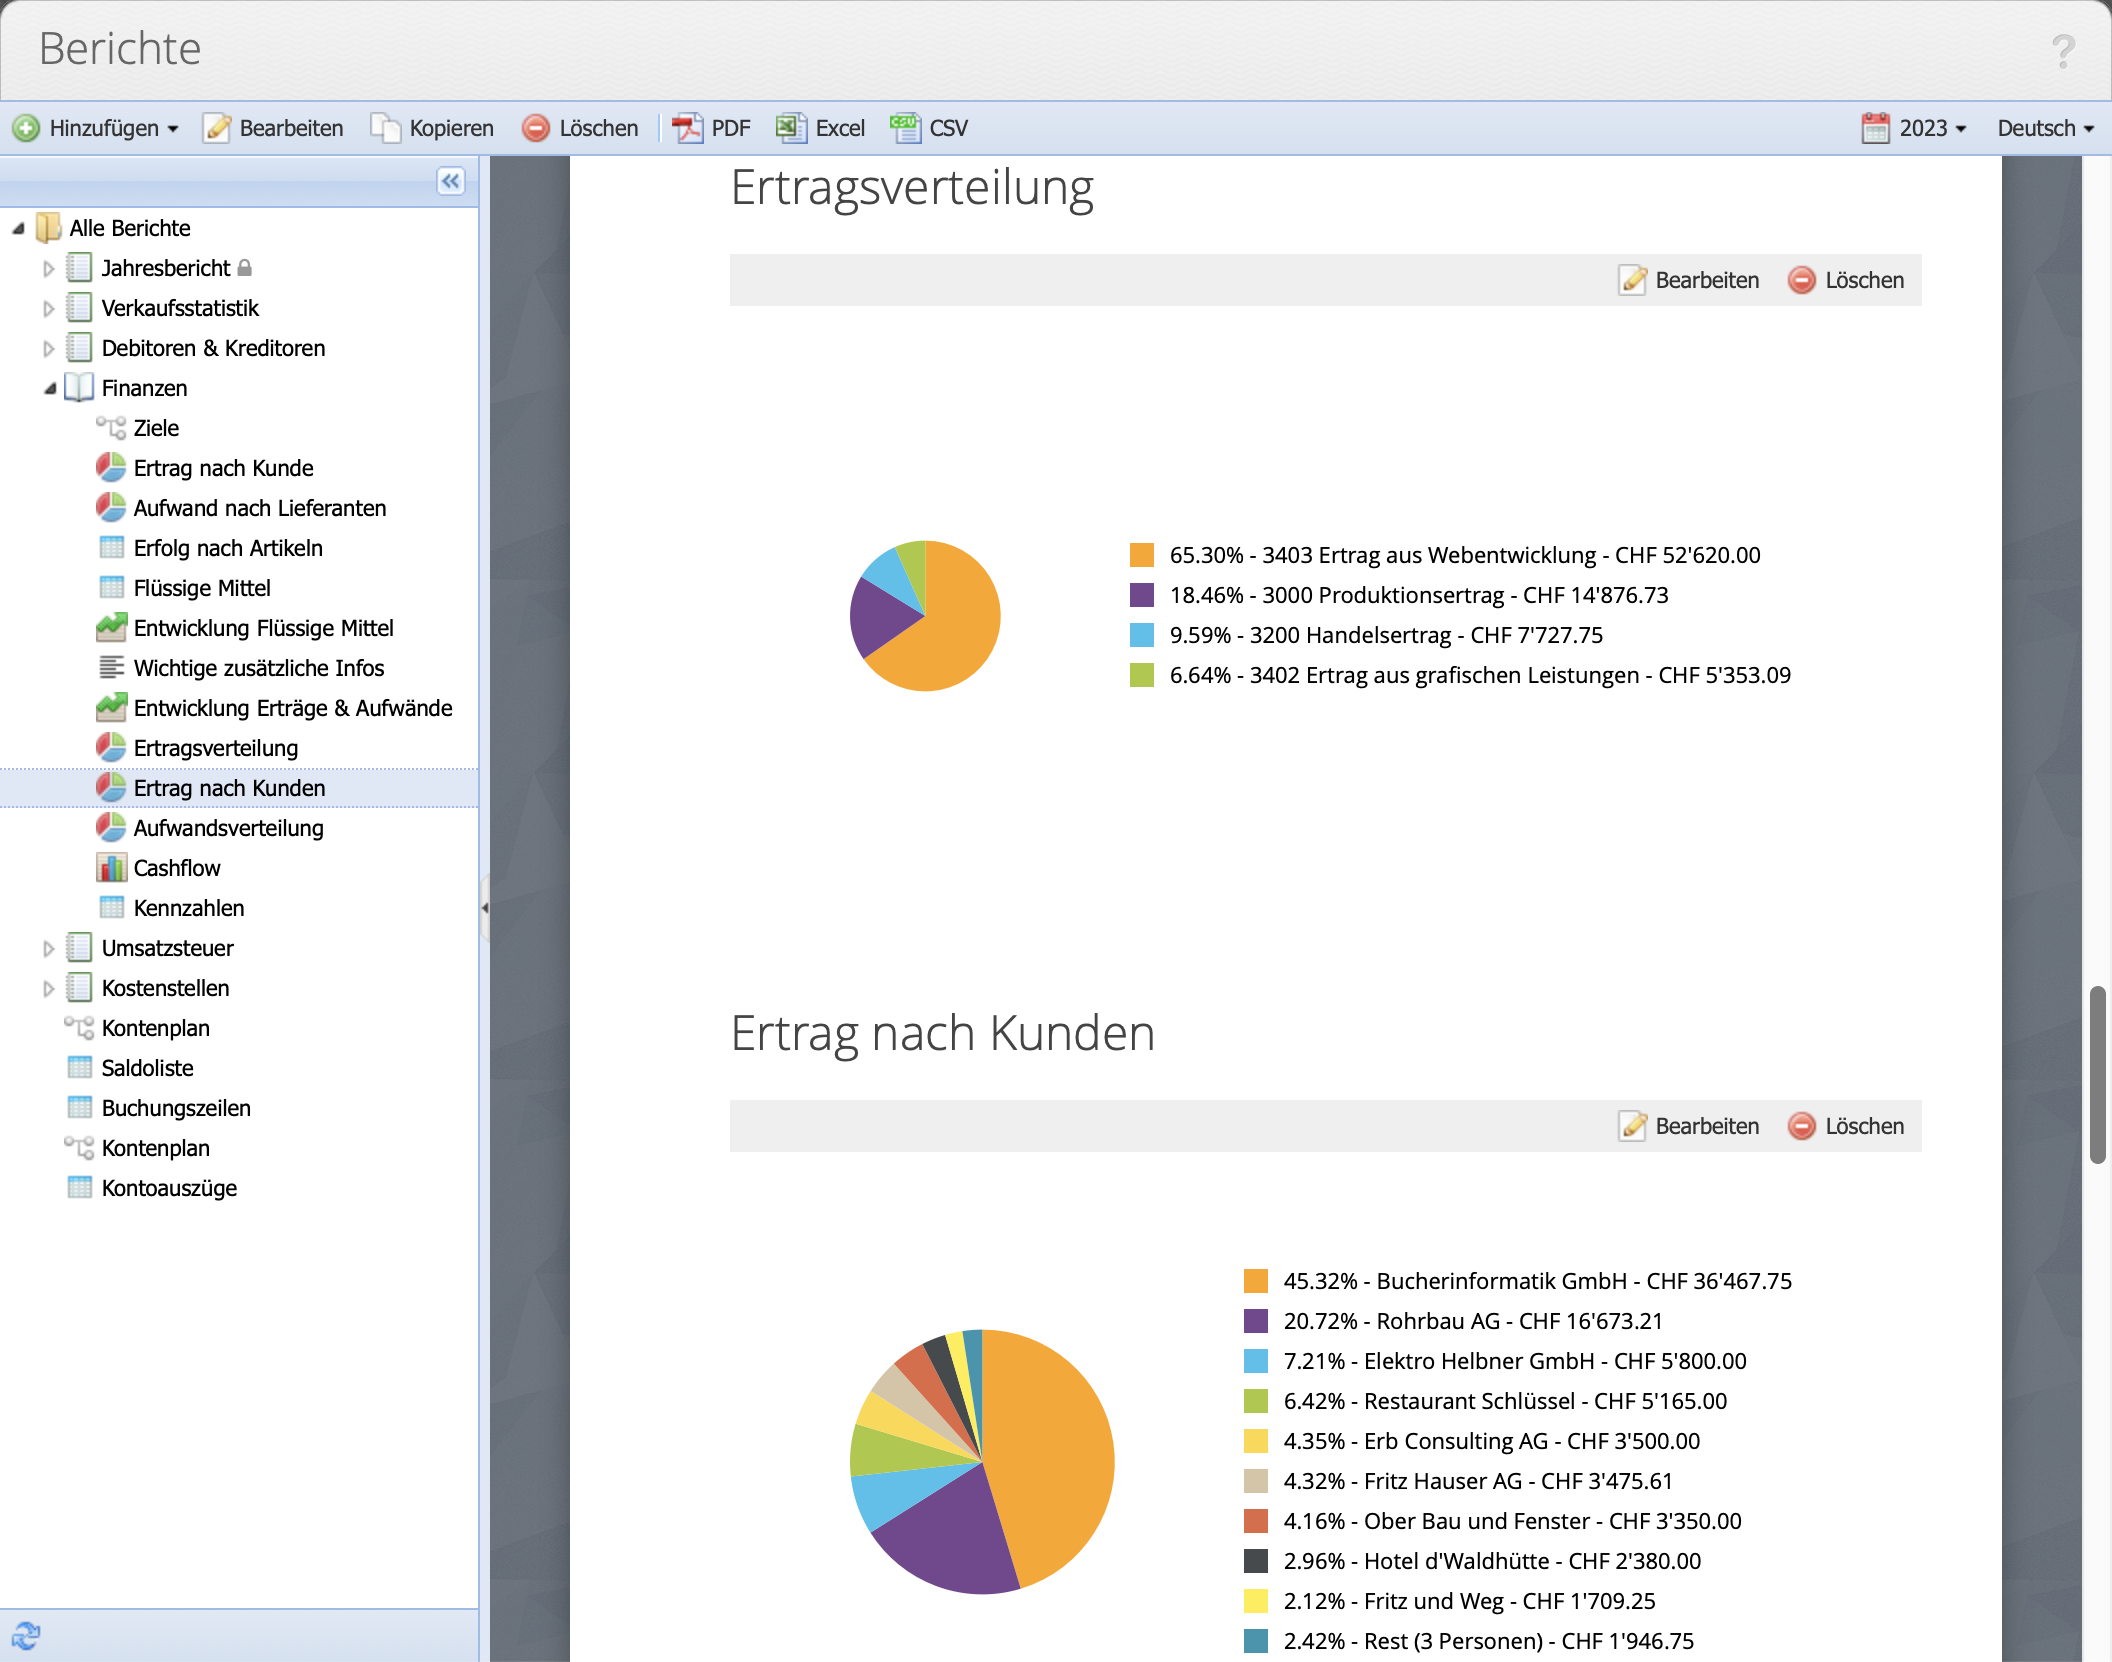
Reports such as: Revenue by Customers, Expense by Vendors and Result by Articles can be presented as a pie chart.
Different accounts and account areas can be compared with the balance share pie chart. The configuration is kept simple. The values can be hidden by clicking on them.
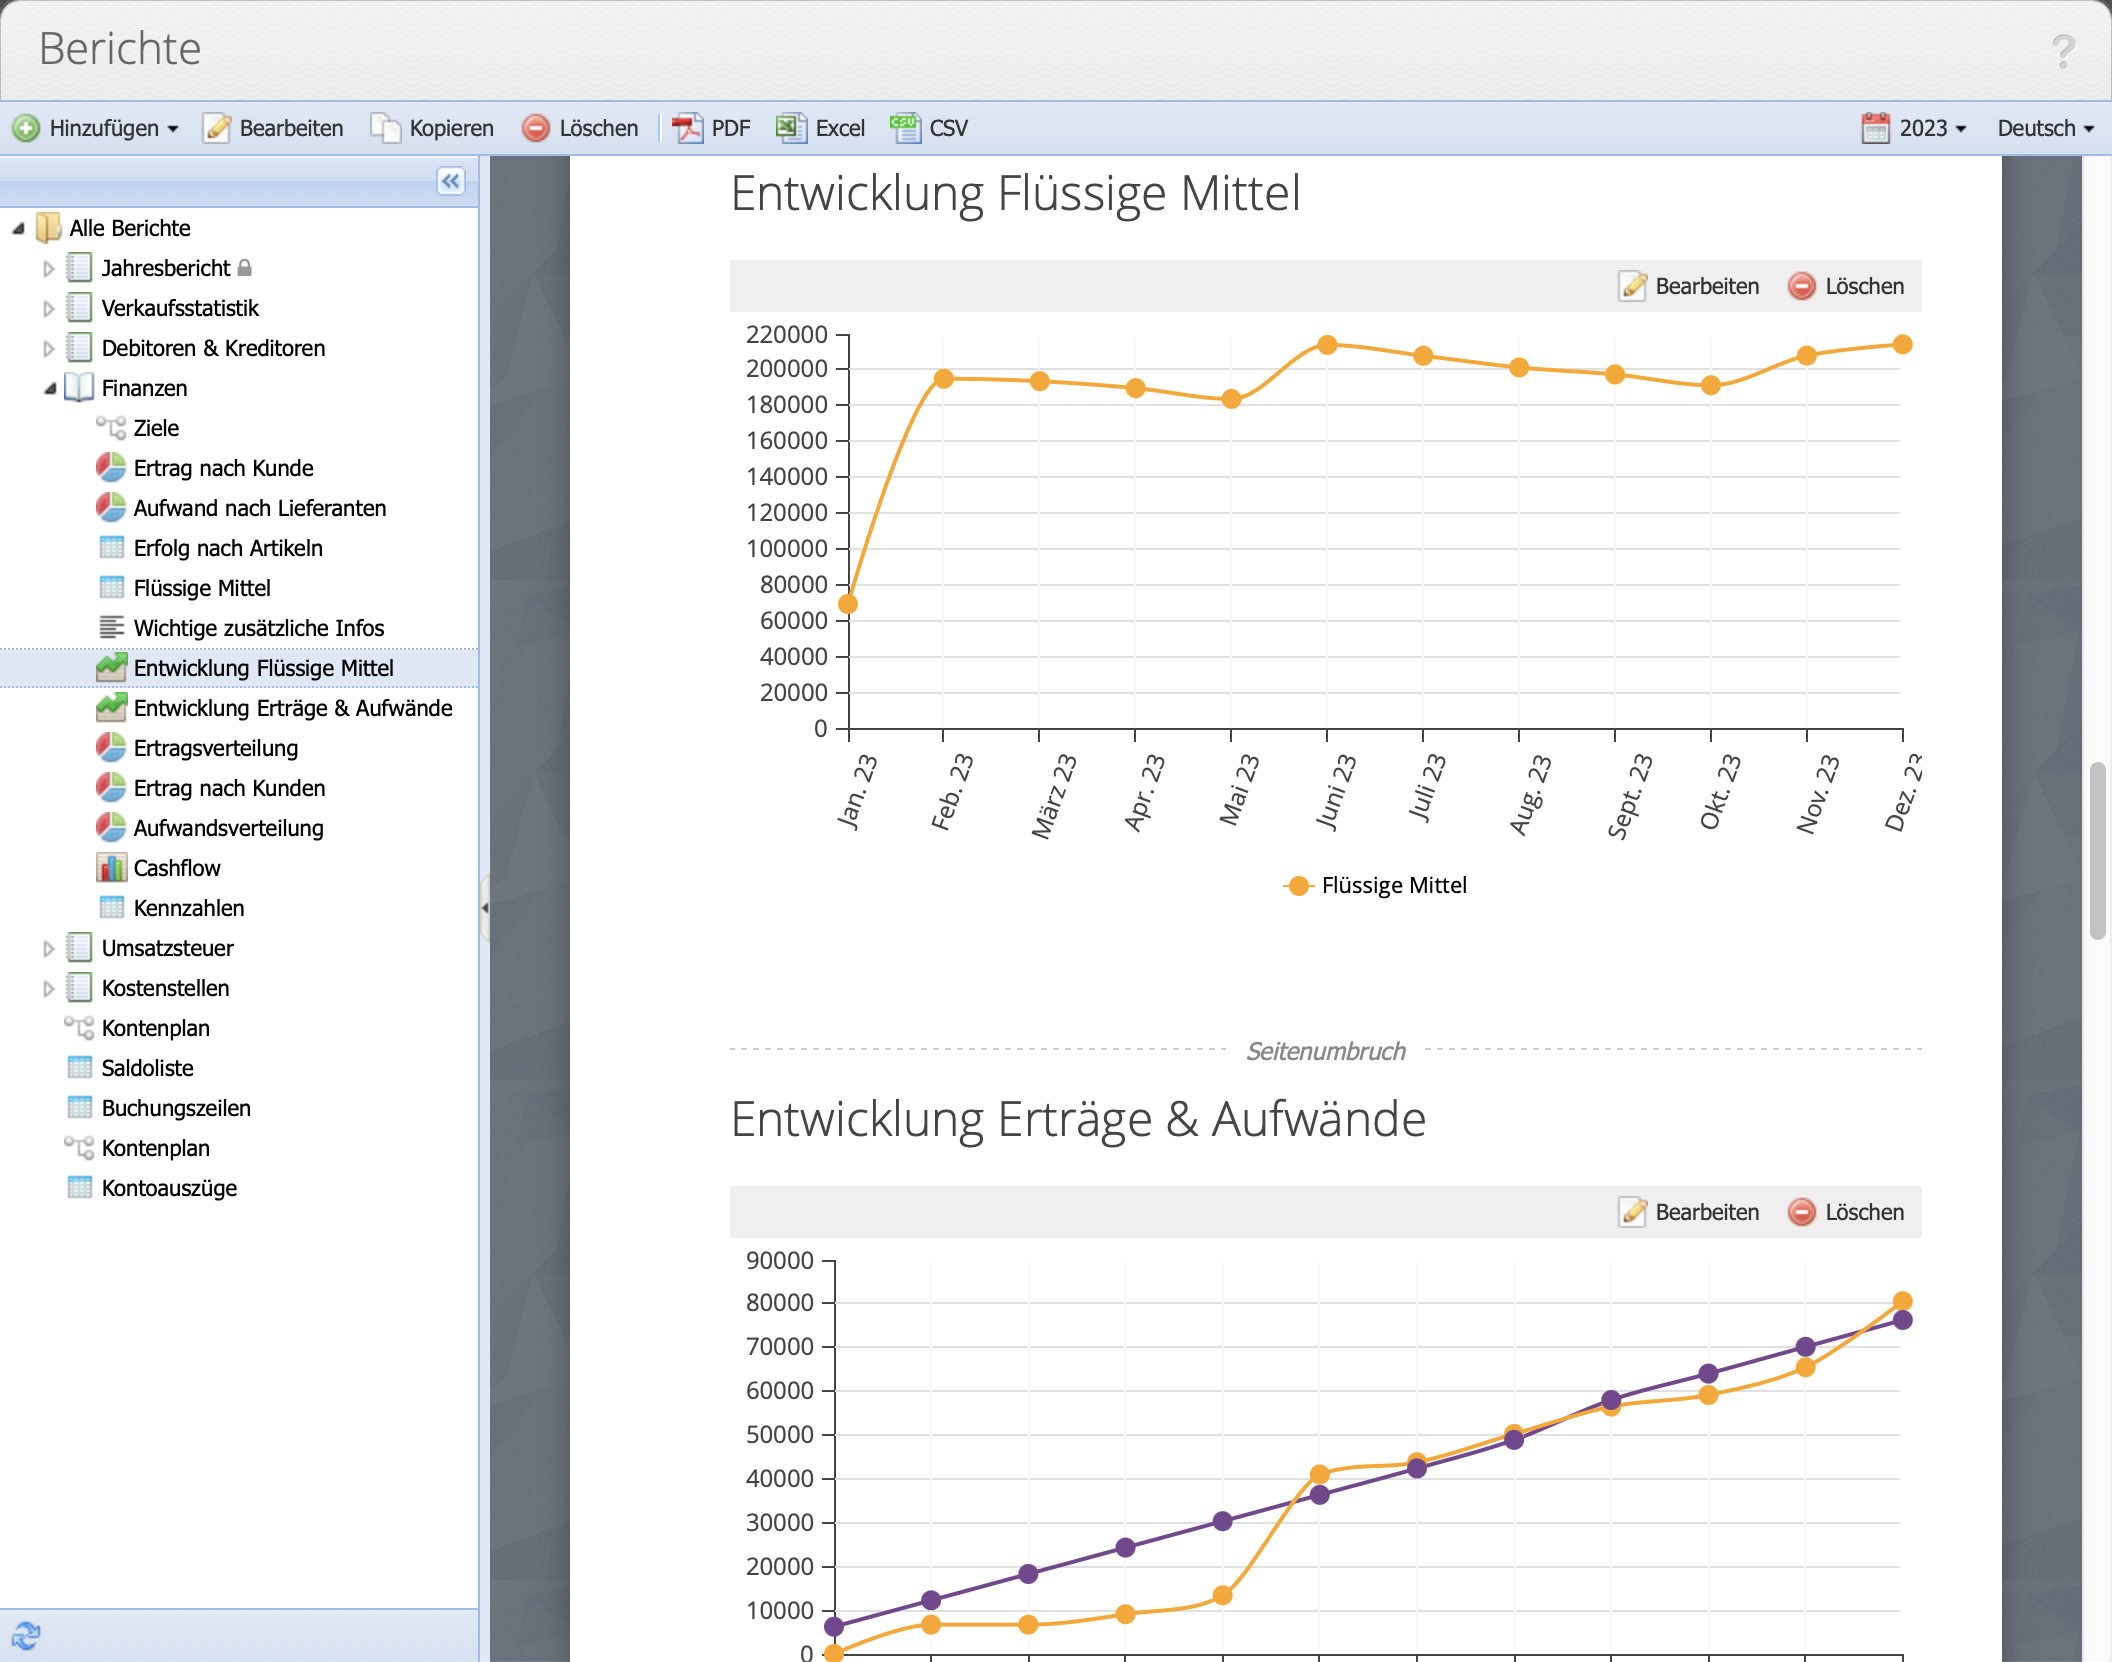
Balance progression provides information about the development of various basic values over time using a line chart. As with the balance list, accounts can be summarized or displayed individually.
Text and image is a completely free element, where any text and/or image can be inserted. The size and orientation of the image can be adjusted.
Thus, terms and conditions or notes to a trustee, client or official authority can be inserted.